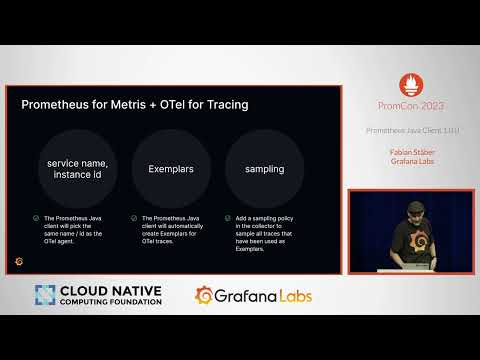
PromCon 2023 - Prometheus Java Client 1.0.0
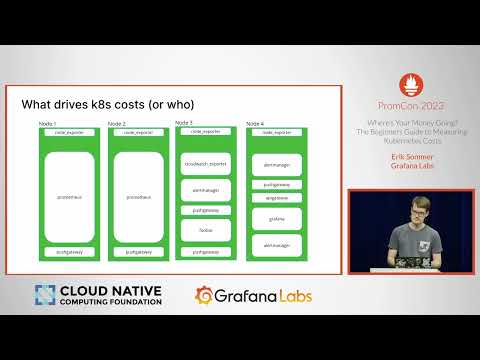
PromCon 2023 - Where’s Your Money Going? The Beginners Guide to Measuring Kubernetes Costs
PromCon EU 2023 - Day 1 Live
PromCon EU 2023 - Day 2 Live
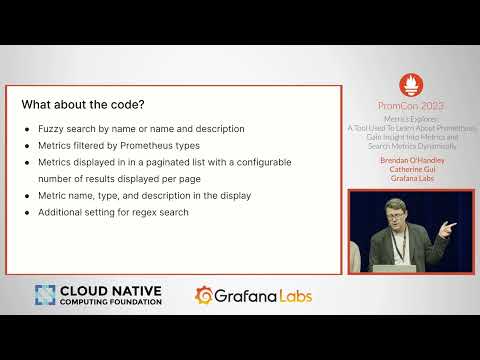
PromCon 2023 - Metrics Explorer: A Tool Used To Learn About Prometheus, Gain Insight Into Metrics
PromCon 2023 - Welcome
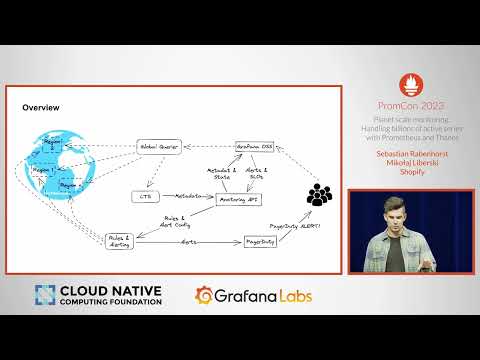
PromCon 2023 - Planetscale monitoring: Handling billions of active series with Prometheus and Thanos
PromCon 2023 - Testing Kubernetes Apps’ Observability End-to-End
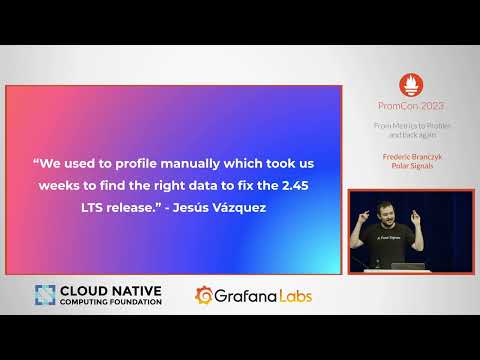
PromCon 2023 - From Metrics to Profiles and back again
PromCon 2023 - Surprise Trivia Quiz
PromCon 2023 - Configuring Your OpenTelemetry Collector for Prometheus
PromCon 2023 - Observing the world's most famous 3D print farm
PromCon 2023 - Learning From Mistakes – Choosing the Right Metrics for Prometheus Alerting
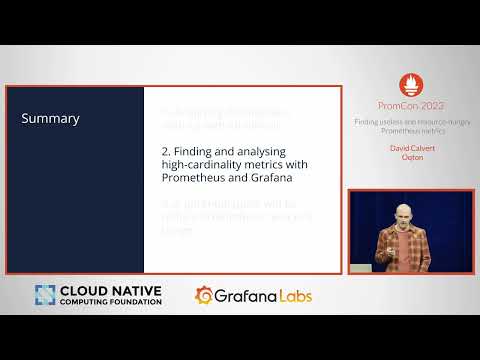
PromCon 2023 - Finding useless and resource-hungry Prometheus metrics
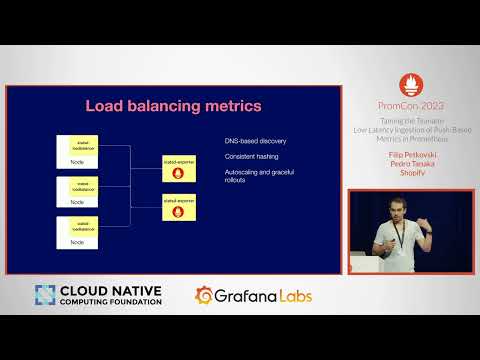
PromCon 2023 - Taming the Tsunami: Low Latency Ingestion of Push-Based Metrics in Prometheus
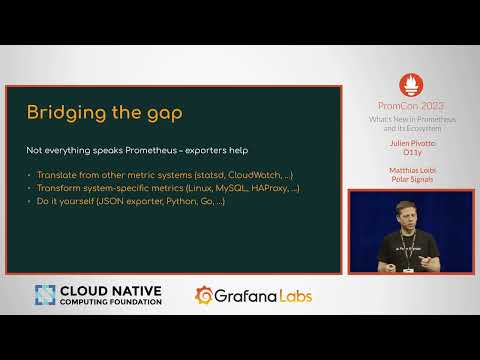
PromCon 2023 - What's New in Prometheus and Its Ecosystem
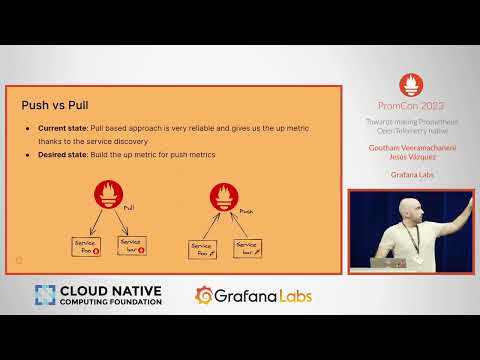
PromCon 2023 - Towards making Prometheus OpenTelemetry native
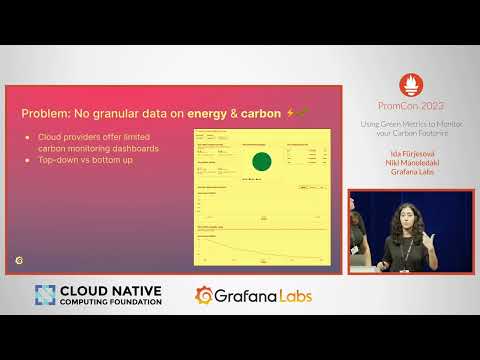
PromCon 2023 - Using Green Metrics to Monitor your Carbon Footprint
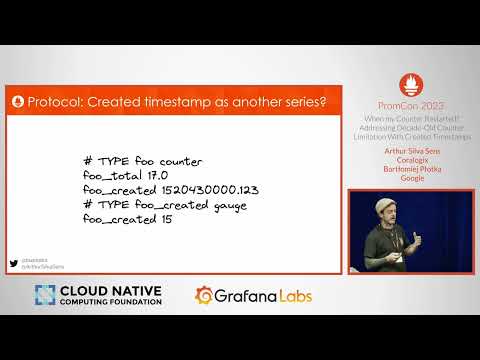
PromCon 2023 - When my Counter Restarted? Addressing Old Counter Limitations With Created Timestamps
PromCon 2023 - Alert Analysis as a Service
Prometheus 3.0 Unveiled: PromCon Highlights with Julius Volz
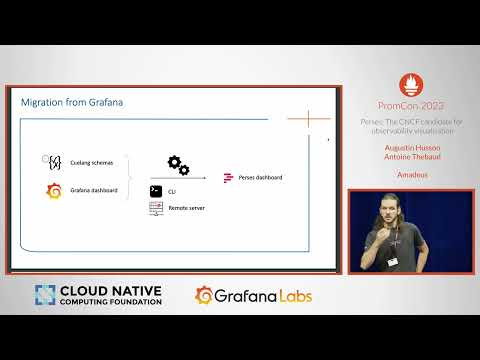
PromCon 2023 - Perses: The CNCF candidate for observability visualisation
PromCon Recap: Unveiling Perses and Prometheus Ecosystem Updates
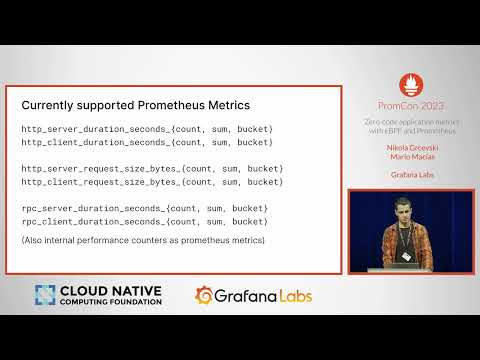
PromCon 2023 - Zero-code application metrics with eBPF and Prometheus
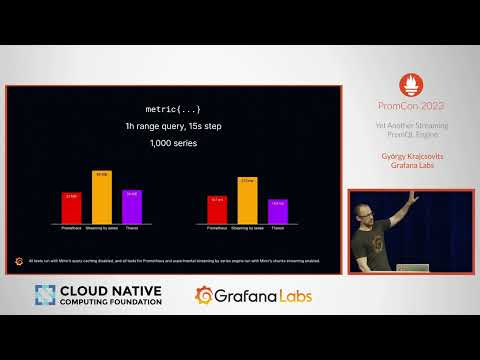
PromCon 2023 - Yet Another Streaming PromQL Engine