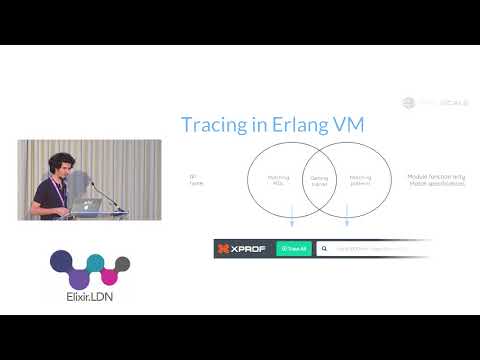
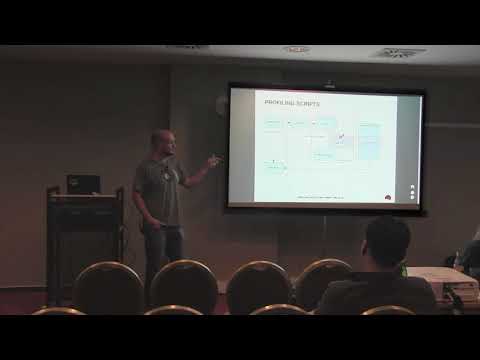
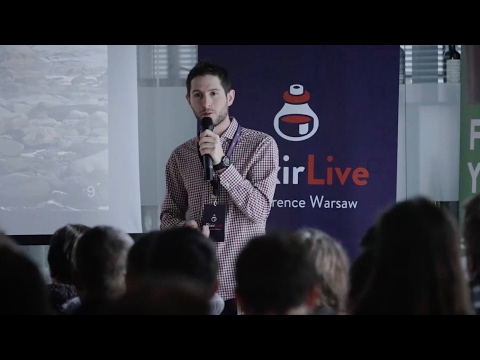
Profiling and Tracing for all with Xprof - Péter Gömöri - Elixir.LDN 2017
Profiling JAX/XLA with XProf in TensorBoard
ML Performance Debugging with XProf | JAX/OpenXLA DevLab Fall 2025
Martin Kjellin, Roberto Aloi - Profiling and Debugging Erlang Systems
ElixirConf 2016 - Debugging Techniques in Elixir by Erich Kist
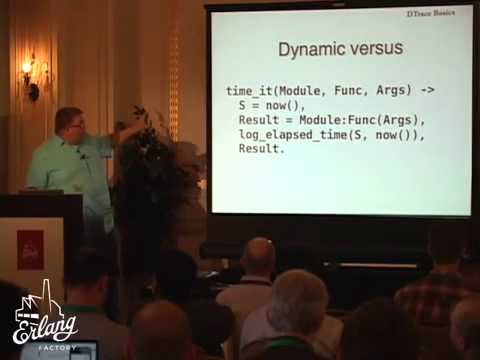
Erlang Factory 2014 -- Profiling Applications using DTrace
XProf solves All Your Performance Issues - Péter Gömöri - EUC17
Elixir Quick Tip: Tracing With dbg
Greg Mefford - Continuous tracing in production (without Erlang's trace module) | Code BEAM STO 19
Trace Debugging With Erlyberly by Andy Till
Tracing Summit 2017 discussion: Profiling scripts with perf
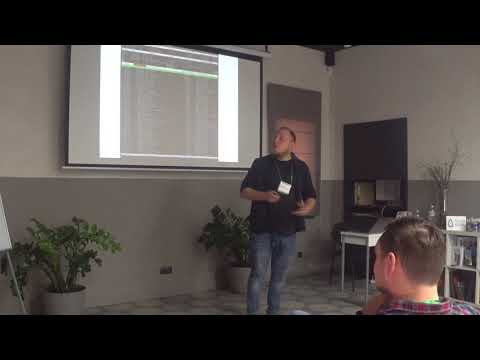
Profiling and tracing BEAM VM - Valerii Vasylkov (RUS) | Elixir Club 13
Tracing Techniques for Elixir - Szymon Mentel | ElixirLive 2016
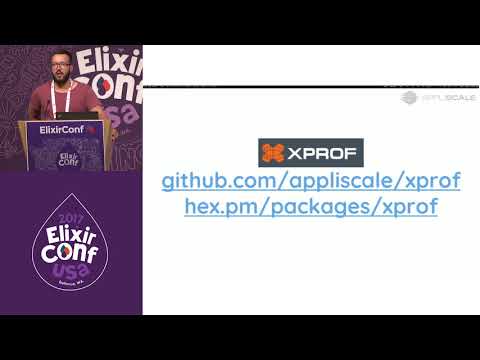
ElixirConf 2017 Lightning Talk - XProf - Wojciech Gawroński
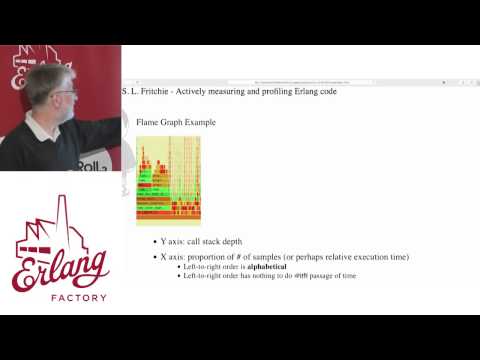
Erlang Factory SF 2015 - Scott Lystig Fritchie - Actively measuring and profiling Code
Flamegraph and heatmap profiling | Edmond Begumisa & Roshan Giri | Code BEAM V
Using the Erlang Observer App with a remote Elixir Phoenix server inside Docker
Lorena Mireles - Erlang Fundamentals for Debugging Elixir
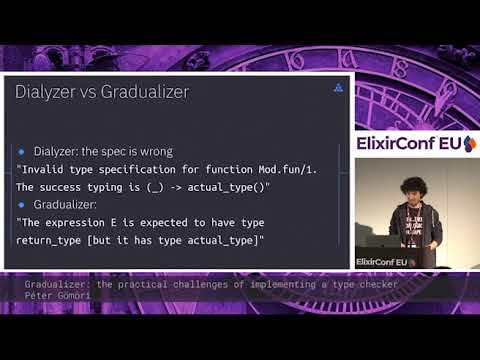
Péter Gömöri - Gradualizer: challenges implementing a type checker - ElixirConf EU 2019
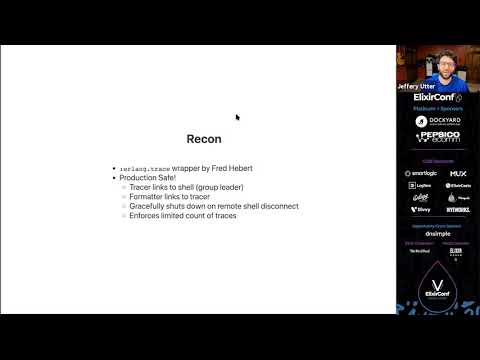
ElixirConf 2020 - Jeffery Utter - Debugging Live Systems on the BEAM
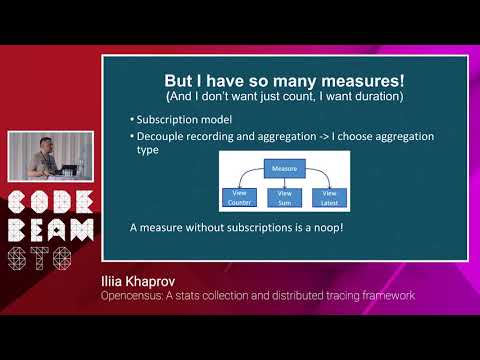
Iliia Khaprov - Opencensus: a stats collection and distributed tracing framework - Code BEAM STO
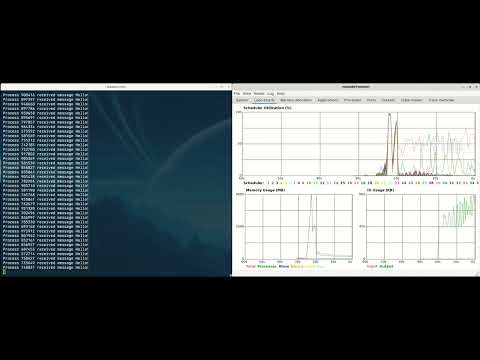
:observer.start() demo with 1 million process spawn in Elixir
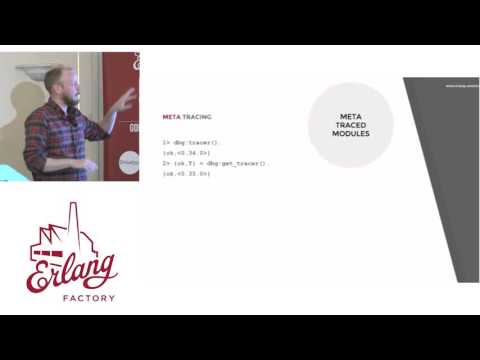
Erlang Factory SF 2016 - Lukas Larsson - The Future Of Tracing
Brooklyn Zelenka at Elixir.LDN 2017 Introduces Her Talk
How We Created Elixir University Course - Nikolay Tsvetinov - Elixir.LDN 2017